What Is Observability? A Plain Guide for Spreadsheet Fans
Summary
What is observability? It is the ability to understand what a system is doing, and why, from the data it emits: logs (events), metrics (numbers over time) and traces (one request's journey). Monitoring flags problems you predicted; observability helps you investigate the ones you did not. This guide explains the difference in spreadsheet terms, shows Sheets and Excel formulas for error rates and percentiles, and compares the tools teams use.

What is observability? It is the ability to work out what a system is doing, and why, using only the data it emits: logs, metrics and traces. If monitoring tells you that something broke, observability lets you ask the next question: where, for whom, and since when. If you live in spreadsheets, you already do a small version of this every time you chase a weird number back to its source row.
The one-minute version for people who live in spreadsheets
Picture a monthly revenue sheet where the total looks wrong. A dashboard that says "total is off" is monitoring. Being able to filter by region, by day, by product and find the one import that doubled 400 rows is observability.
Software teams hit the same wall with live systems. A checkout page gets slow. An alert fires. Now somebody has to figure out which service, which customer segment and which deploy caused it. The data that makes that possible is called telemetry, and how well you can use it is what people mean by observability.
Biscuit has a version of this too. He doesn't need to be told the ball is lost. He needs to retrace where the ball was last seen.

Monitoring vs observability: known problems vs surprises
Monitoring watches things you decided to watch in advance. CPU above 90 percent, error rate above 2 percent, a page that stops answering. You write the rule, the tool shouts when the rule is broken.
Observability is for the problems you did not write a rule for. The OpenTelemetry project describes it as a way to understand a system from the outside, without knowing its inner workings, which helps with "unknown unknowns".
Skip the idea that one replaces the other. Monitoring is your smoke alarm. Observability is the floor plan and the camera footage you pull up afterwards. You want both.
Logs, metrics and traces: the three raw ingredients
Almost every explanation lands on the same three signals. Here is each one in spreadsheet terms.
Logs are timestamped messages about individual events. In a sheet, that is one row per event: time, user, action, result. They hold the most detail and take the most space.
Metrics are numbers aggregated over time, like error rate, requests per minute or memory used. In a sheet, that is your summary tab. Cheap to store, quick to chart, but they cannot tell you which single request failed.
Traces follow one request as it travels through several services, with the time spent at each step. In a sheet, think of one order ID that you track across five tabs, noting how long it sat in each.
The usual shorthand: metrics tell you something is wrong, traces tell you roughly where, logs tell you the detail. Here is what that looks like in a real cell, in a minute.
You have 5,000 log lines in a file: a worked example in Sheets
Say you exported 5,000 lines of an application log into Google Sheets. Column A holds the timestamp, column B the service name, column C the status code, column D the response time in milliseconds. Works in Excel and Sheets unless noted.
First, the error rate, a classic metric:
=COUNTIF(C2:C5001, ">=500") / COUNTA(C2:C5001)The range is C2:C5001, the status codes.
The criterion
">=500"counts every server error.Dividing by
COUNTAgives the share of all requests. Format the cell as a percentage.
That is monitoring: one number, one threshold. Now the observability part. Which service is responsible?
=QUERY(A1:D5001, "select B, count(C) where C >= 500 group by B order by count(C) desc", 1)This one is Sheets-only, because QUERY has no Excel twin. The arguments:
The data is A1:D5001, headers included.
The text is a small SQL-like query: count the errors per service, biggest first.
The final
1says there is one header row.
In Excel 365 you get the same answer with a different recipe:
=LET(s, FILTER(B2:B5001, C2:C5001>=500), u, UNIQUE(s), HSTACK(u, COUNTIF(s, u)))That needs Excel 365 or 2021, since FILTER, UNIQUE and HSTACK are not in Excel 2016. Older versions are better served by a pivot table.
And for the slow requests, the 95th percentile is more honest than the average:
=PERCENTILE(D2:D5001, 0.95)If the average response time is 180 ms but the 95th percentile is 2,400 ms, one in twenty users is having a bad day. Averages hide that, which is exactly the trap observability tools try to help you avoid.
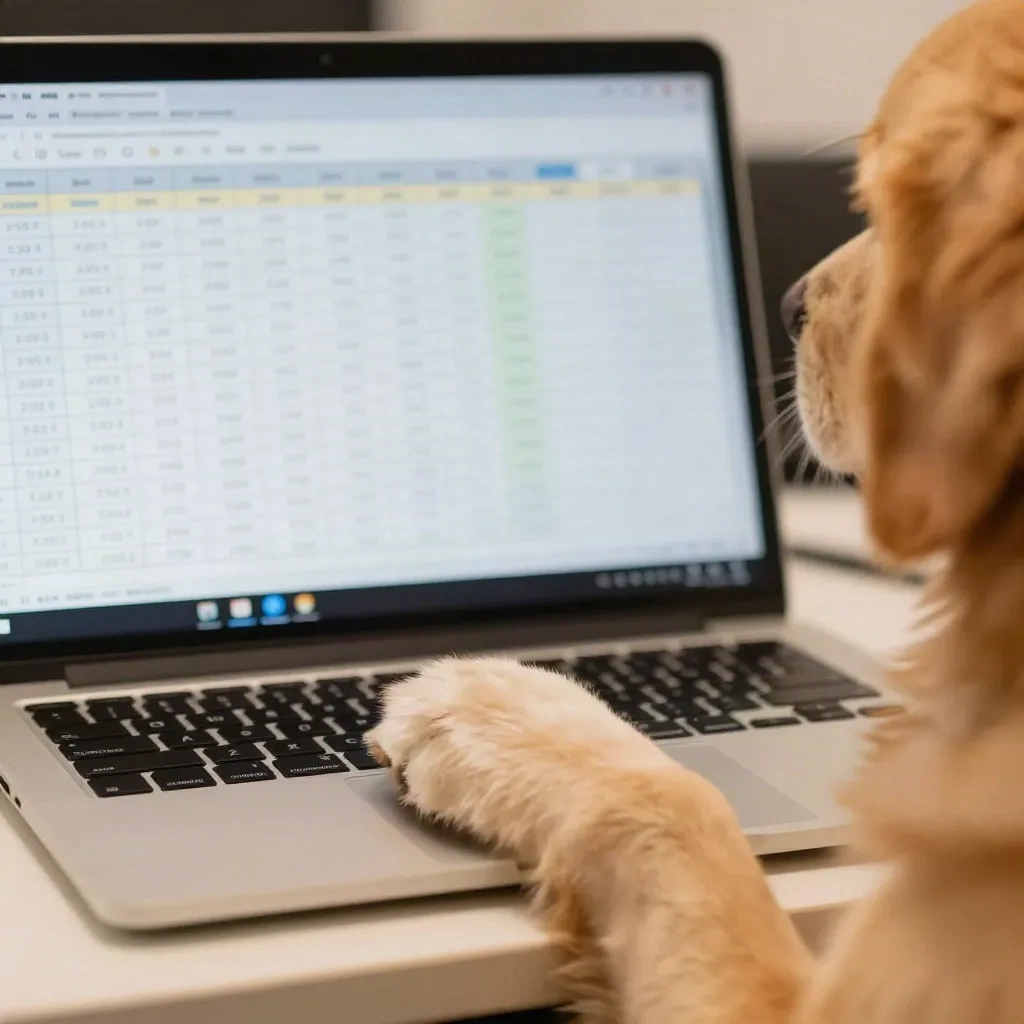
Biscuit already fetched it for you if the formula is the part you forget. Formula.dog turns a plain-English description into one of these.
Where observability shows up in a normal workday
You do not need to run servers to bump into it. A support lead who asks "why did tickets double on Tuesday?" is doing it. So is a finance analyst who traces a variance back to one supplier invoice, or an ops person who finds that a nightly import silently skipped a file.
In software, the same questions get sharper because systems are distributed. One click on a button can touch an API gateway, an auth service, a database and a payment provider. When it fails, the error message you see is rarely the place where it started. A trace shows the whole chain, with the slow or broken link highlighted, so nobody has to guess.
Three terms come up constantly, so here they are in plain words:
Instrumentation is adding the code that emits telemetry. Think of it as adding a timestamp and an ID column to a report that never had them.
Cardinality is how many distinct values a field can take. Region has low cardinality, user ID has very high cardinality. High-cardinality fields answer the sharpest questions and cost the most to keep.
SLO (service level objective) is a target you promise yourself, such as "99.5 percent of checkouts finish in under two seconds". It turns vague worry into a number you can watch.
Why a pile of dashboards is not the same thing as observability
Here is the opinion that annoys vendors: having all three signals does not mean you have observability. If metrics live in one tool, logs in another and traces in a third, someone has to line them up by hand at 2 a.m. That is the equivalent of three workbooks with no shared ID column.
The test is simple. When something unexpected breaks, can you ask a new question of your data without shipping new code? If the answer is "we'd have to add logging and redeploy", you have monitoring with extra steps.
Two things make the difference in practice:
Context on every event. Each log line carries a request ID, a service name and a version, so you can group and filter later. It is the ID column you wish every export had.
Detail kept long enough. High-cardinality data (user IDs, order IDs) is where answers hide, and it is also what pushes the bill up.
The tools people actually use, and what each one costs you
You do not need to buy anything to understand the idea, but the market is worth knowing.
OpenTelemetry is the open standard for producing telemetry, not a place to store or view it. You instrument once and send the data wherever you like.
Grafana Cloud is built around open standards, with a free tier of 10,000 active metric series and 50 GB each of logs, traces and profiles per month. You can also self-host the open-source stack, at the price of assembling Prometheus, Loki and Tempo yourself.
Datadog is the turnkey option: install the agent, get working dashboards in minutes, one place for infrastructure, APM and logs. The catch is billing. Per-host pricing (around $15 per host per month for infrastructure alone) plus separate charges for logs and custom metrics can climb fast past about 50 hosts, and there is no permanent free tier.
New Relic sits in between on pricing: 100 GB of data ingest per month free, then $0.40 per GB, with one full platform user included.
Worth the splurge if: you have a small platform team and no appetite for running infrastructure about your infrastructure. Skip if: you have two servers and one developer. A good log format and the formulas above will take you surprisingly far.

What to do on Monday if you are not an engineer
You may never touch a trace. But observability thinking transfers well to anyone who reports numbers for a living.
Add an ID to every export. A column you can join on beats any clever formula.
Keep the raw rows. Do not paste values over the detail tab. Summaries are metrics, raw rows are logs.
Write down what "normal" is. A threshold you never defined cannot fire.
Ask the third question. "Revenue is down" is the alert. "Down where?" is the metric. "Down because of which rows?" is observability.
Do that and the next odd total in your sheet will take ten minutes to explain instead of an afternoon. Good boy, spreadsheet.
Quick answers to the questions people actually type
Short versions of the most common follow-ups are in the FAQ below. If you remember one thing: observability is not a product you buy, it is how well the data your system emits lets you answer questions you did not plan for.